Cooperative Research Centre for Australian Mineral Exploration Technologies (CRC AMET)
Key Words: exploration, electromagnetics, airborne, regolith, depth slice, TEMPEST
Airborne EM is the only remote-sensing technique capable of rendering a three-dimensional image of the subsurface. The wide frequency content of modern systems enables the separation of near-surface and deeper features that cannot be resolved with potential-field techniques such as gravity and magnetics. Exploration under conductive cover requires high-power, low-noise data acquisition for penetration, combined with a broad frequency range for depth resolution.
Over the past five years airborne electromagnetics (AEM) has undergone a revolution in measurement accuracy, spatial resolution and interpretability. Previous-generation AEM systems were designed to be bump hunters, where anomalies hopefully coincided with buried conductors such as massive sulphides. Unfortunately in the regolith-dominated terrains that characterise much of Australia, AEM data commonly show numerous conductors, most of which can be attributed to regolith inhomogeneity rather than the isolated conductive targets of sulphide exploration. In the past, these responses have been treated as noise. However, increasingly they are being interpreted as geological signal.
Our present understanding of the wide applicability of AEM in Australia is an outcome of an integrated research and development program pursued by CRCAMET over the last six years, which has been directed to improving the technology and interpretability of airborne EM data in regolith-dominated terrains. This effort has culminated in the recent release of the broadband, low-noise TEMPEST airborne EM system, and the EM Flow software package for rapid processing and display of AEM conductivity-depth sections.
The development of new-generation AEM systems, together with advanced techniques for data processing and display, offer exciting opportunities to further develop the application of AEM technologies for exploration through cover. Significant advances have been made in the processing and presentation of AEM data, so that maps of physical property variations and sections of conductivity structure are now standard output. These products lend themselves to analysis and interpretation by geologists in a manner not dissimilar to the way aeromagnetic images are used. Case studies illustrate the potential of AEM to map bedrock geology and structure beneath cover in various geological settings in Australia.
Areas with thick regolith cover present some of the most formidable challenges to exploration both in Australia and overseas. Whilst major advances have been made in the practice of exploration through the regolith, a major impediment to further improvement is a limited knowledge of the nature and variability of regolith with depth. Airborne electromagnetic (AEM) data have a considerable potential to advance our understanding of regolith and bedrock structure in areas where cover materials dominate. This is particularly the case in areas where weakly- or non-magnetic rocks occur under transported cover and aeromagnetics is ineffective.
The advent of new AEM systems such as SALTMAP, TEMPEST, GEOTEMDEEP and DIGHEM, have brought improvements in bandwidth, instrument sensitivity and noise reduction. Together with new techniques for data processing and display, we believe AEM technologies can now be used more effectively across a wider range of exploration activities in regolith dominated terrains rather than simply as a direct targeting tool for massive sulphide mineralisation. Significant advances have been made in the processing and presentation of AEM data, whereby maps of physical property variations and sections of conductivity structure are now standard. These products lend themselves to analysis and interpretation by geologists in a manner not dissimilar to aeromagnetic images.
Historically, AEM has been very successful in the search for highly conductive massive sulphide deposits, particularly in resistive shield areas such as Canada. By contrast, in the regolith-dominated terrains that characterise much of Australia, AEM data are often dominated by variations of conductivity within the regolith and are difficult to interpret. In order to penetrate the regolith, to see under cover, it is necessary to measure to sufficiently late times (for time-domain systems) or low enough frequencies (for frequency-domain systems) for the induced eddy currents to diffuse into the underlying bedrock. Traditionally this has been achieved by increasing transmitter power and measuring to later times. However, high power alone is not sufficient in resolving ambiguities in interpretation between the response of changes in regolith thickness and those of deeper conductors. A sufficiently broad bandwidth, such as provided with new-generation AEM systems such as TEMPEST (Lane et al., 2000) is needed to resolve surficial conductivity variations from those of deeper bedrock conductors.
Thus, two distinct approaches to AEM exploration have emerged. The first approach, sometimes referred to as bump hunting or direct target detection, seeks to recognise the presence of buried conductors such as massive sulphides as discrete AEM anomalies, usually at late sample times after the regolith-dominated response has dissipated. The second approach recognises that the broadband AEM response contains valuable information about the geology of rocks obscured by the regolith, mineral systems, and the regolith itself.
Because AEM responds to variations in weathering, the AEM method provides the basis for a new generation of both regolith and geological maps incorporating sub-surface information unobtainable from other data types. AEM can be used to map geology directly, through resistive cover, or indirectly by exploiting relationships between the conductivity profile and weathering patterns. In contrast, information derived from air photos, remote sensing imagery and radiometrics relates to very shallow depths and is often dominated by the properties of cover sequences, whilst magnetics responds variably to regolith, largely because of the dispersed character of magnetite relative to fresh rock. In landscapes with a long and complex history, understanding the nature of regolith materials at depth may a critical link in unravelling the development of a landscape and to establishing the source of geochemical pointers to significant mineralisation.
Modern rapid processing techniques enable the conversion of large AEM data sets to 3-D images of conductivity. The example shown in Figures 1 and 2 is a 1996 QUESTEM data set from the Matchless Greenstone Belt in Namibia. The area is almost entirely covered by sand with virtually no outcrop. An aeromagnetic survey was used to predict the approximate location of the Matchless amphibolite belts under cover prior to the AEM survey. The AEM data was processed with EM Flow software developed by CRC AMET. EM Flow (Macnae et al, 1988) converts AEM data into conductivity-depth image (CDI) sections, consisting of stitched 1-D images, which are then interpolated to form a 3-D section.
The area flown in the survey is covered by around 30 m of conductive sand cover, increasing in saline water content to the east. In the deeper 120 – 150 m depth slice, the response to the west shows conductivity variations interpreted as folded metasediments and metavolcanics within the greenstones. In the eastern half of the greenstone belt, relatively uniform conductive cover extends to depths of over 100 m. Towards the southeastern quadrant, more resistive bands show evidence of linear trends seen in aeromagnetics, which delineate overthrusts. A number of the most conductive features at depth are quasi-linear and cut across the overall east-west trend of bedrock conductors. They show evidence of branching and are interpreted as crosscutting palaeochannel features. It is possible to identify the shallow and deep ends of the palaeo-drainage features with respect to the current surface.
Resolution of the deeper geology (210 300 m) is degraded compared to the near surface, but mapping of broad structure, such as the prominent folded conductor at centre-left, is clearer at depth than in the shallower depth slices.
The physical properties of regolith materials have a profound effect on geophysical response. Although the combination of deep weathering and alluvial-colluvial cover often complicate analysis and interpretation, these characteristics may also be used to advantage for exploration through the regolith.
Marked resistivity (or conductivity) contrasts within a regolith profile are readily detected with electromagnetic data. Regolith materials are commonly porous and contain water along with dissolved salts. The presence of conductive clays and saline groundwater yield resistivities of 0.1 to 100 ohm-m (conductivities in the range 0.01 to 10 S/m). At the base of the weathering profile the transition between saprolites to essentially unweathered rock is reflected in a marked decrease in conductivity. Fresh rock of non-sedimentary origin tends to have resistivities of the order of 5000 ohm-m or greater, although ultramafics can often be somewhat less resistive.
The conductivity contrasts within the regolith, between transported cover and in situ materials, and at the irregular interface between the saprolite – saprock-bedrock interface (the weathering front) can often be well resolved by the new generation of airborne electromagnetic systems, which have skin depths ranging between 5 and 150 m.
A regional-scale TEMPEST survey along the Gilmore Fault Zone in central NSW was recently commissioned by CRC AMET, the Bureau of Resource Sciences (BRS), AGSO and the CRC for Landscape Evolution and Mineral Exploration (CRC LEME). Bounding surfaces, defining top of regolith materials and the top of fresh rock were determined using a three-layer inversion procedure. A relatively resistive upper layer represents transported alluvium and colluvium, a conductive second layer represents saprolitic materials, and a resistive lower layer represents fresh rock.
Figure 3 shows a 15 x 20 km subset of these data. The geometry of the lower surface, which approximates the weathering front, shows a relationship with interpreted bedrock geology as defined by airborne magnetics. The patterns identified by the AEM inversion indicate a strong dependence on bedrock lithology, manifested as variation in conductivity and interpreted thickness of the conductive layer. The presence of buried strike ridges or bedrock highs, indicating litho-dependence on weathering, could be significant in their effect on groundwater flow direction and their influence on landscape development. Understanding their distribution may help constrain geochemical dispersion studies and geochemical sampling techniques in the regolith. Similar observations are warranted for the surfaces that define the top of the conductor. This surface defined as representing the top of conductive regolith may, in places, provide some indication of the morphology of palaeo-landscapes, particularly where transported overburden forms a significant part of the regolith.
Palaeo-and Meso-Proterozoic sediments in some highly prospective parts of Australia often lack significant magnetic susceptibility contrasts, and mapping by magnetics is ineffective. Where these rocks are weathered, and where they are characterised by a complex regolith including transported overburden and a varied vegetation density, the application of other mapping technologies such as radiometrics or remote sensing may also be difficult. It is in such areas that AEM can be particularly effective, mapping complex structures and lithology that is masked or buried by cover.
Figure 4 illustrates the potential benefits that arise from using AEM to map mapping structures and lithology in the Western Succession of the Mt Isa inlier in northern Queensland. These data were acquired by the GEOTEM-75Hz system. The survey area covers folded and faulted Meso-Proterozoic sedimentary rocks of the McNamara Group which are unconformably overlain in the west by Cambrian sediments of the Georgina Basin. The study area extends northwards 100 km from the Lady Loretta Zn-Pb-Ag deposit, and has potential for hosting other base-metal deposits. The AEM data have been processed using simple image display and enhancement techniques, in this case principal-component analysis (Green, 1998) which enable rapid analysis of the geological information content of the data. In the Mt Isa case, subtle contrasts in the conductivity of essentially non-magnetic sediments are enhanced. These sediments include dolomitic, siliceous and carbonaceous siltstones, laminated shales, sandstones, conglomerates and limestones. The AEM data reveal structure and stratigraphic variations that were not identified in previous mapping.
Modern broadband airborne EM systems, combined with rapid imaging and inversion routines that generate three-dimensional conductivity images of the earth, provide a valuable tool for exploring within and underneath cover. In regolith-dominated terrains, knowledge of the nature and distribution of regolith materials provides important information on the geology, on mineral systems, and on geochemical dispersion mechanisms.
The combined work of many people is represented in this paper, and the authors acknowledge the many other contributors in CRC AMET. We thank AGSO, BRS and CRC LEME for permission to reproduce the Gilmore data shown in Figure 3. This paper is published with the permission of CRC for Australian Mineral Exploration Technologies, established and supported under the Australian Government’s Cooperative Research Centres Program.
Green, A, 1998, The use of multivariate statistical techniques for image display and geological mapping using the Apparent Dipole Depth method, in, B. Spies, D. Fitterman, S. Holladay and G. Liu (Eds): Proceedings of AEM 98: Exploration Geophysics, 29, 77-82.
Lane, R., Green, A., Golding, C., Owers, M., Pik, P., Plunkett, C., Sattel, D., Thorn, B., 2000, The TEMPEST Airborne Electromagnetic System: Exploration Geophysics (submitted).
Macnae, J., King, A., Stolz, N., Osmakoff, A, and Blaha, A., 1998, Fast AEM processing and inversion, in, B. Spies, D. Fitterman, S. Holladay and G. Liu (Eds), Proceedings of AEM 98: Exploration Geophysics, 29, 63-169.
Figure 1. 3-D conductivity image of QUESTEM data from the Matchless Greenstone Belt in Namibia. Survey size 200 km x 40 km.
Figure 2. Conductivity slices at depths of 0 30 m, 120 150 m, and 210 – 300m from the Matchless Greenstone Belt data set. Palaeochannels are evident in the middle section.
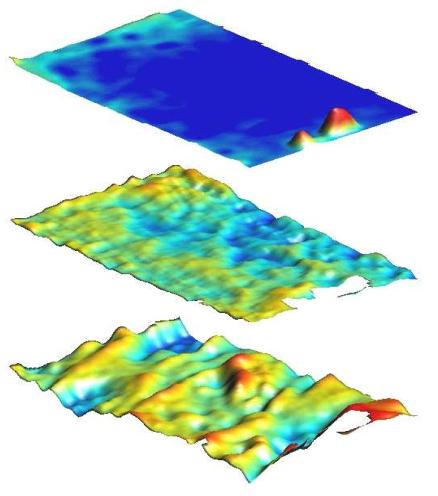
Figure 3. Bounding surfaces derived from TEMPEST AEM data, Gilmore, NSW. Top surface – contemporary topography. Mid surface – top of the regolith conductor. Lower surface base of conductor, approximating the morphology of fresh rock. Image size 15 km E-W by 20 km N-S.
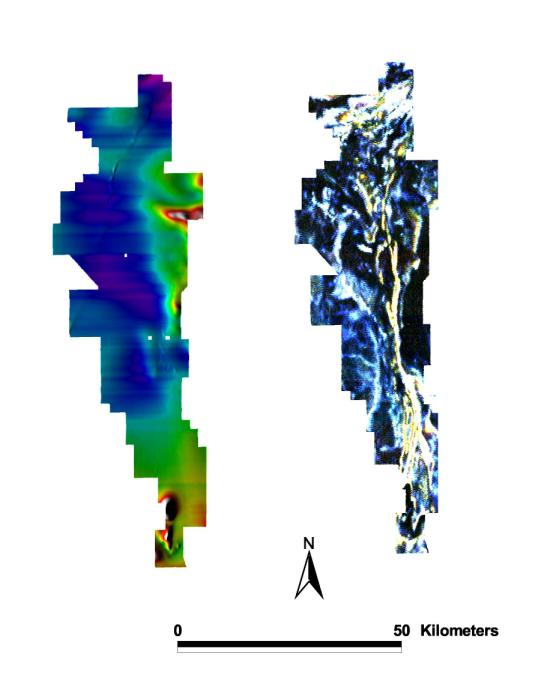
Figure 4. Magnetics (left) and principal components of GEOTEM airborne EM data (right) from the Western Succession of the Mt Isa inlier.