I.M.Mason, P.J.Hatherly, B.Zhou & J.H.Cloete
C.M.T.E. University of Sydney, CSIRO DEM, & Stellenbosch University
geoimm@es.usyd.edu.au
The depletion of ore reserves in South Africa is driving gold mining to extreme depths. Concern over the violent release of the high pressure fluids and paleo-stresses that are sometimes trapped by deep faults and dykes has led deep mine planners to seek a technology that is capable of “detection of geological structures with a displacement of 2m 200 m ahead of mining at an acceptable cost”. A similar mapping need is met in coal mining, where a throw of less than a meter can bring a longwall coal shearer to its knees, and inject ash over 10% of the face line if it is decided to carry the fault.
Geological uncertainty attacks mine mechanization. Machines lift output per man shift dramatically but are inflexible, concentrate capital; and lower the number of production points in a mine. Disrupted seams can only be tackled by machines that can maintain the line of an advance, should a roof descend locally (as it did in Figure 1). Mine managers maintain a constant flow of ore into the mill by stockpiling; by contracting in extra miners, or (as was the case in the 1970’s UK coal industry), by setting up spare longwalls ready to go, should a production point hit trouble. Coping with faulting is expensive and it ties up machinery. The use of production machinery to create a geological fault map misuses resources.
 Figure 1: “Pothole” in a Queensland seam
Planners need strategic maps of large faults to establish the axis of a mine or to optimise shaft locations. Managers need high resolution sub-meter tactical maps to manoeuvre men and machinery productively around rolls, potholes, faults, dykes. Here we review the role of mine site data processing in long range 3D surface seismic reconnaissance mapping; and close-in tactical underground mapping with radar deployed in in-mine boreholes.
A.M. Clarke was introduced oil-field management concepts such as reserve-recovery rate to the UK coal industry in the early seventies. Under his direction Ziolokowski et al adapted oil seismology to the mapping of 3000’ deep UK coal seams. Early Australian field trials of 2D reflection seismic fault detection techniques were shot in the far shallower coal seams at Cook and Leichhardt Collieries (Rutter and Harman, 1979). In subsequent decades Poole of BHP-Billiton and others developed a viable shallow 3D seismic mine mapping technology (Poole et al, 1998). They were assisted by developments – in Australia, Germany, and in the USA – in high resolution 3D seismic data acquisition, and low cost high speed computation.
It is now becoming standard in Australia to cover proposed coal mine sites by 3D seismic imaging before making any underground commitment[1]. This work has parallels in the coal-fields of Britain, Germany and China. Similarly in the gold fields of South Africa there has been a sustained campaign to use 3D seismic imaging to map major fault blocks in the deep gold bearing structures on the West Wits Line. (Pretorius et al, Campbell 1990) A comparable effort has been mounted to map the Bushveld’s platinum reefs (Davisson & Chunnett 1999, Larroque et al 2002).
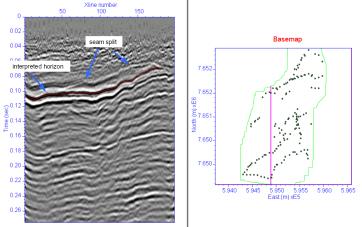
Figure 2. Left and centre, faults on seismic sections from 3D seismic surveys can be mapped on a basemap to show their lateral continuity (from Zhou and Hatherly, 1999). Right, a 3D perspective of a ‘volume’ of 3D seismic data.
In 3D surveying, seismic energy is injected at a succession of surface grid points, and reflections from sub-surface discontinuities are sensed by surface geophone arrays. During processing, the records are filtered, stacked, edited and finally migrated to form a $5m data cube like that shown on the right-hand side of Figure 2. Site preparation and acquisition typically consume over two thirds of the typically A$350k/km2 budget. Planning and processing each cost around 10%.
Interpretation involves assigning geological meaning to slices through this cube which, while it might look like a block of rock, is a frozen 3D pattern of sound. The task can be carried out on a laptop PC using purpose designed software that is only a little harder to handle than MS Word®. Figure 2 shows how 2D slices can be pulled interactively from a storage disk by clicking on top of the data cube. Vertical faults can be found using geological insight, guided by subtle discontinuities that line up on the vertical succession of reflectors.
· Plan-positions of the intersections of these faults with the seam’s reflection are automatically located on the basemap that lies at the center of Figure 2. If the fault picks are valid dots on the basemap line up as one moves through the cube, a slice at a time.
· Lateral correlations along the seam’s echo provide a guide to its depth. It is not always easy to make these correlations because variations not only in the seam but in its host change the echo,
In picking events it is necessary to link the judgement of a human to the power of a machine. In Figure 3 we show a typical 2D resolution dilemma that calls for human judgement; and a coarse 3D grid that is constructed by teaching a machine to judge on a limited number of in- and cross-line 2D data slices. The coarse training grid density rises in areas with complex echo patterns. The network of supervised decisions then guide horizon-picking algorithms as they crunch through the rest of the data cube tracking the spatial attributes (depth, reflectivity, semblance etc) of the seam.
Figure 3: (a) Decision dilemma needing human intervention (from Zhou and Hatherly, 1999). (b) Coarse grid, recording supervised decisions that then spread across the target automatically.
Figure 4: Seam depth images (a) sun 25o E of north, 40o elevn. (b) sun 130o W of north, 30o elevn. (from Zhou and Hatherly, 1999).
Resolution influences mine planning. Signal-to-noise and attenuation set fault detectability, bandwidth limits the mis-interpretation of structured interference from adjacent horizons, vertical velocity modelling precision determines location accuracy. Sub-wavelength resolution is possible – subtle phase changes can be detected in a marker horizon if noise does not capture the system. Shaded relief out-performs contouring in digging sub-wavelength objects out of noise. Figure 4 shows how shifting the sun angle changes visibility. On the left there is a strong NE trend to the ‘fabric’. Different features are resolved on the right, but details in the centre are lost.
In 1910 Leimbach and Lowy buried EM dipole antennas in an array of vertical boreholes and compared the magnitude of low frequency signals when successive dipole pairs were used to transmit and receive. They proved that a crude shadow image could be formed of an ore body within the array, which absorbed EM radiation. The antiquity of their effort is not surprising. German academic interest in mining has always been high, and scientists were pupils of Hertz. By the early thirties, Fritsch (1934) was using radios to map underground conductivity variations. Post WW-II South African miners studied EM propagation through metamorphic rocks in order to communicate by radio between adjacent gold mines, and Vermeulen (1965) of Rand Mines “shadow imaged” in-mine cavities 10 feet in diameter at ~335kHz. Moving up to the VHF band, shadow imaging techniques were used to probe aquifers, coal in-situ gasification tunnels, oil shale retort burnfronts, copper ore bodies (Holmes and Balanis 1977; Annan and Davis 1978, Rao and Rao 1983). In 1976 Lytle et al imaged a tungsten deposit located between two boreholes (Lager and Lytle 1977, Lytle, Laine, Lager, Davis 1979, Lytle & Dines 1980). At around this time workers at SWRI San Antonio developed 30-300MHz BHR for the detection of tunnels beneath the Korean DMZ. Wang (1983) cites a number of very competent studies of Chinese crosshole EM survey work, carried out simultaneously to the north of the DMZ, that were ultimately applied to tasks such as detecting the margins of old coal mines.
Several groups world-wide are developing VHF borehole radars. The supply position is dynamic and needs no permanent record. We simply observe that few sondes are thin enough to enter hard rock 47mm boreholes; that the market for hard rock borehole radar is minute; and that few mines wish to develop exotic electronic hardware. Driven by curiosity about the validity of military-level prices for borehole radars; in `91/92 we breadboarded, in June 92 we fired up and in 92/93 we stabilised the design of a slimline digital borehole radar. Our probes are 32mm diameter, & just over 1.75m long. Specifications[2] compare to those of most standard surface ground penetrating radars. Ours currently are the world’s only wideband VHF slimline digital radars with a proven capability of operating in hot (70C) hardrock boreholes.
Long inclined boreholes are drilled from precious metal mine workings in order to secure assay samples with which to contain development risks. Leaving aside the value of detecting small faults in advance of laying out a mine, it is useful to discover the structural context of each sample, for reef thickness and grade varies in both gold and platinum mines as a function of the local dip. A sample taken from a roll or terrace slope is liable to be thin and of low grade; one from a paleo-stream channel might be thick and of unrepresentatively high grade. In November 1999 and again in February 2000 we profiled the borehole illustrated in Figure 5. The radar started at the base of the conductor pipe, passed through the Ventersdorp Contact Reef 305 m from the collar before cutting through two dykes into the underlying quartzites. The VCR can be tracked from a height of 100 m (~1.6 ms). Its echo disappears at around trace 780 as the radar enters a dyke. Other scatterers are identified by capital letters in an inset. Figure 6 shows three views of a vertical section through the reef. Range resolution cell size is set by absorption.
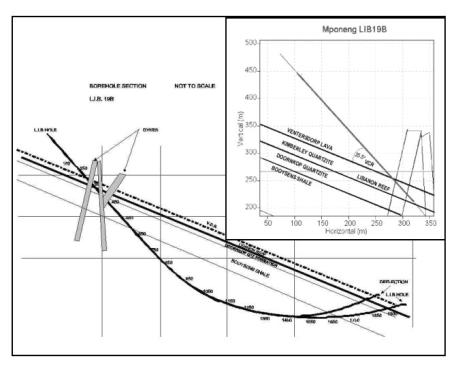
Figure 5 (a): Long inclined borehole penetrating the VCR at 25 degrees
Figure 5(b): Slimline borehole radar profile of the top 375m of the hole in Figure 5(a)
Figure 6: Borehole radar cross-sections through the VCR. Resolution <1m
SUMMARY & CONCLUSIONS
Accurate maps are needed to control the risks involved in mechanised mining of thin reefs. Ore-flow ripples rise both in amplitude in inverse proportion to the number of faces feeding a given smelter; and in frequency with the number of face-stopping faults that are met unexpectedly in a given time. Strategic and tactical maps are dynamic in the sense that interpretations update as new data comes to light. Just as the Officer of a Watch at sea is not guided by the maker of a marine radar but relates the map on a radar PPI display to the changing scene around him, so it is important that $5m 3D seismic data cubes be repeatedly revisited and re-interpreted by geologists and miners who are both familiar with the area and alive to the consequences of decision[3] and can fully grasp new information that emerges as mining proceeds.
Underground “cover-holes” are currently drilled to allow miners to skirt or cement grout fluid bearing faults. Geological boreholes are drilled to sample and delineate reef. Borehole radar can use these holes both to extend the accident protection they offer, and to map small obstacles, such as faults, rolls, and potholes that are screened from surface view by earlier workings, by reverberation within overlying reefs, or by attenuation. The ease of coupling BHR antenna makes profiling repeatable. Borehole radars could rapidly become both simple and cheap enough for geologists and mine deputies to run BHR surveys (say) as soon as the first underground borehole in a fan is completed, and then interpreted at the mine site using exactly the same PC software as was used to create the strategic planning 3D image in Figure 4. The interpretation could be completed in time to optimise the direction of the next borehole in the fan.
It clearly is possible to use a VHF borehole radar to detect reflections from objects that lie close to or on the Ventersdorp Contact Reef, at radial ranges of 100+m from the borehole. We know that its host rocks do not uniquely favour the VCR. A number of important precious metal reefs are embedded in good dielectrics. More effort needs to be put into simplifying borehole radars and conveying to the geologists, drilling supervisors and mining engineers who we believe will eventually run them the nature of the risks associated with false alarms and detection failures. More work needs to be done, too, to understand propagation conditions in the strata hosting important reefs.
Many of the ideas in this paper were developed in close collaboration with Greg Poole of BHP-Billiton, Stewart Greenhalgh of the University of Adelaide, Greg Turner of Senseore Systems and the Radar Imaging groups at Stellenbosch and Cape Town Universities. A.C.A.R.P. contributed, as did ARCO British Ltd, to the development of mine-site 3D data reduction software. Min Li, then of GeoSonde, handled the bulk of the Windows programming effort. The support of the Centre for Mining Technology and Equipment, the Australian Research Council and the Atlantic Richfield Benefaction is also gratefully acknowledged.
ARMSTRONG R. A., COMPSTON, W., RETIEF E. A., WELKE H. J., 1991. Zircon ion microprobe studies bearing on the age and evolution of the Witwatersrand triad. Precambrian Research, 53, pp. 243-266.
DURRHEIM R. J., HAILE A., ROBERTS M. K. C., SCHWEITZER J. K., SPOTTISWOODE S. M. AND KLOKOW J. W. 1998. Violent Failure of a remnant in a deep South African gold mine. TECTONOPHYSICS 289 (1998) 105-116.
GUILBERT J. M., & PARK C. F., 1986. The geology of ore deposits. W. H. Freeman and Company, New York, pp. 742-773.
JOHNSON RA & SCHWEITZER J, 1996: Geotechnical classification of deep and ultra-deep Witwatersrand mining areas, South Africa.: Mineralium Deposita. 32; 4, Pages 335-348. 1997.
MALAN DF & BASSON FRP, 1998: Ultra-deep mining; the increased potential for squeezing conditions.: Journal of the South African Institute of Mining and Metallurgy. 98; 7, Pages 353-363. 1998. .
MCCARTHY T. S. 1994. A review of the regional structural controls on the occurrence and character of the ventersdorp contact reef. Economic Geology Research Unit Information Circular No. 276.
MCCARTHY T. S. 1994. The tectno-sedimentary evolution of the Witwatersrand Basin with special reference to its influence on the occurrence and character of the Ventersdorp Contact Reef – A Review. South African Journal of Geology 97(3) pp. 247-259.
MCWHA M. 1994. The influence of landscape on the Ventersdorp Contact Reef at Western Deep Levels South Mine. South African Journal of Geology 97(3) pp. 319-331.
ROBERTS M. K. & SCWEITZER J .K. 1999. Geotechnical areas associated with the Ventersdorp Contact Reef, Witwatersrand Basin, South Africa. The Journal of the South African Institute of Mining and Metallurgy. MAY/JUNE 1999.
VAN DER WESTHUIZEN W. A., BRUIYN H. D. & MEINTIES P. G. 1991. The Ventersdorp Supergroup: an overview. Journal of African Earth Sciences Vol. 13 (1). Pp83-105.
WINTER H DE LA R (1995). The Ventersdorp Contact Reef in relation to the Witwatersrand Basin and overlying Ventersdorp volcanic rocks. S.Afr.J.Geol. 97, 247-259.
Zhou, B., and Hatherly, P., 1999. Interpretation of small scale geological geatures on seismic reflection data. Final report, ACARP project C7026.
[1] Recent financial press commentaries have commended efforts to cover MIM’s coal mine lease areas by 3D seismic survey.
[2] 20kW pulsed, 10-100MHz with resistively loaded dipoles, 12 bits real-time digitization.
[3] Local experts must be involved, for a priori information that only they have plays a critical role in decision making; and geophysicists are traditionally long gone when a mining crisis arises.